Vibration monitoring · New Jersey & Eastern PA
Machines change before they fail.
McCartney Diagnostics turns vibration data from motors, pumps, compressors, and fans into clear condition indicators and frequency analysis. Developing changes become visible early enough to investigate on your schedule instead of during a line-down emergency.
A conversation, not a sales pitch · no cost
How it works
The goal is simple: convert raw machine vibration into evidence your maintenance team can understand, compare, and act on.
Capture vibration at the machine
A properly selected and mounted sensor records the machine under real operating conditions. Sensor range, sample rate, location, speed, and load are matched to the equipment being monitored.
Define healthy operation
Healthy readings establish the machine's normal ranges for overall vibration, shock, impact severity, and frequency content. Known maintenance history improves the reference when it is available.
Make changes visible
New readings are compared with the machine's baseline. Trends and frequency spectra help distinguish ordinary variation from changes worth investigating before maintenance becomes an emergency.
Vibration-analysis demonstration
Healthy operation and bearing damage leave different signatures.
This prototype processes drive-end vibration from the Case Western Reserve University Bearing Data Center. Each line shows consecutive 0.25-second observations under the same 1 HP operating load. Green represents a healthy bearing and red represents a documented inner-race fault.
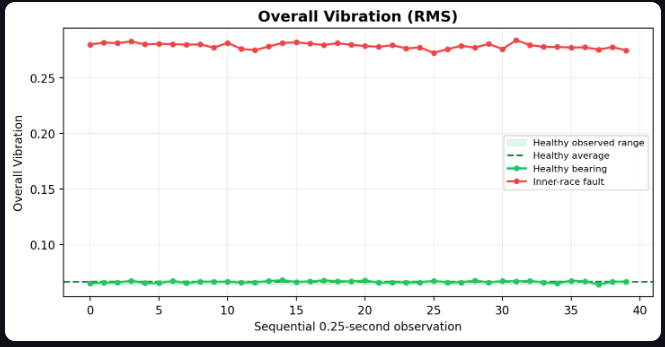
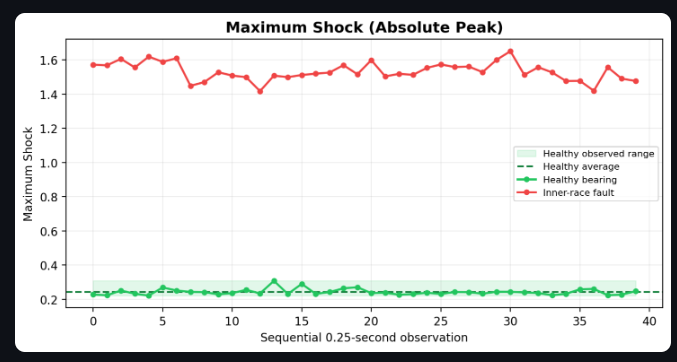
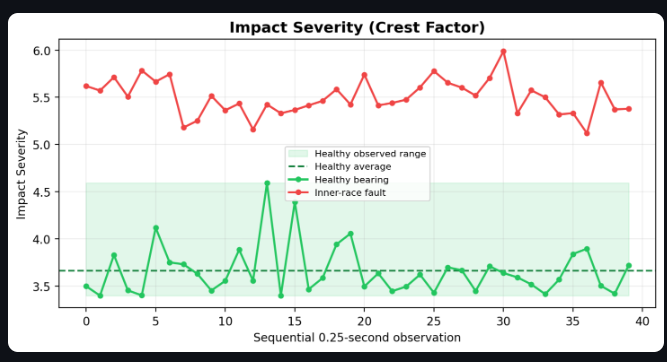
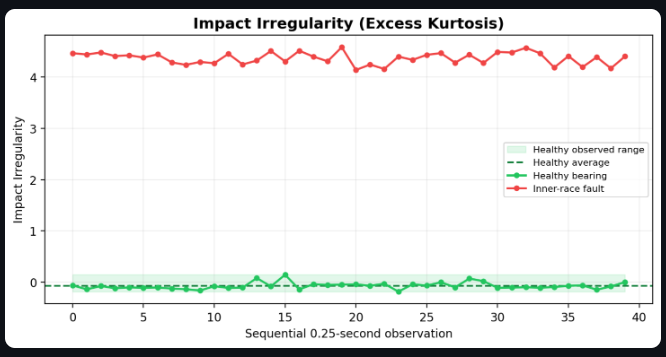
The value is not any single number by itself. It is the consistent separation across several independent indicators, viewed against a machine-specific healthy reference.
The frequency spectrum shows where the vibration changed.
The healthy observation concentrates around a 360 Hz peak. The documented fault produces a stronger, broader response with its largest peak near 2,580 Hz. Frequency analysis helps reliability teams connect a change in overall vibration with the frequencies driving it.
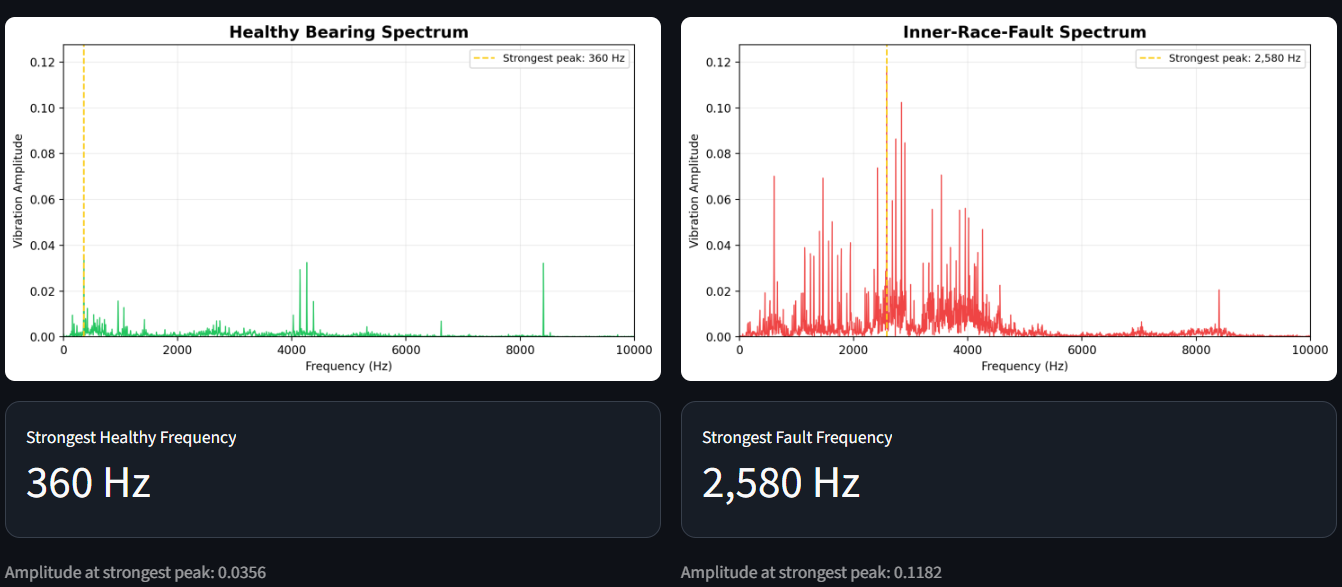
FIG. 5 / HANN-WINDOWED DRIVE-END FREQUENCY SPECTRA · HEALTHY BEARING VS DOCUMENTED INNER-RACE FAULT
Demonstration results use labeled laboratory bearing data and are intended to show the analysis workflow. Production baselines and alert limits must be established for each machine, sensor, mounting position, operating speed, and load condition.
Tell me about the machine you trust least.
I'll walk the floor with you and learn which machines cause the headaches, how your team catches problems today, and what kind of early warning would actually be useful. We can identify candidate assets, operating conditions, practical sensor locations, and whether vibration monitoring fits the problem before any equipment is purchased.
No contract · no obligation · just a conversation about your equipment